How Much Is Not Using AI Costing Your Clinic? Four Numbers Will Tell You
Every AI vendor selling into healthcare right now leads with a number. Recovered revenue per physician, extra appointments booked, calls answered after hours. The numbers are large and they are almost all the vendor’s own. You do not need theirs. Four numbers from your own practice will tell you what the gap is worth, and whether software can close it.
Before you buy software, the cheaper line is usually the one you already pay. HealingMaps’ GPO, the first built for the ketamine industry, gets member clinics 40 percent or more off medical supplies, 15 to 20 percent off malpractice and liability premiums, discounted LegitScript certification, and 20 to 30 percent off HIPAA compliant payment processing. Joining is free with no obligation. See what your clinic qualifies for →
| The Number | How to Get It |
|---|---|
| Calls you did not answer | Your phone system’s unanswered and after-hours report, 30 days |
| Inquiries that never booked | Inbound inquiries in that period, minus consults scheduled |
| Consults that never started | Consults held, minus patients who began an infusion series |
| Series not finished | Patients who started, minus patients who completed the protocol |
| What a patient is worth | Your own induction series price, not an industry average |
| Our reference band | $425 median per infusion, $2,100 median induction series, from 49 of our city guides |
Start With What a Patient Is Actually Worth
Every number below converts to dollars through one figure, so get that one right first. It is the revenue from a patient who completes your induction protocol, not the price of a single visit.
Across 49 of our city guides, the median advertised price is $425 per infusion and $2,100 for an induction series. The middle half of per-infusion prices runs $300 to $600.
Use your own number rather than ours. Take a clinic at $600 with a six-infusion protocol. Its per-patient value is more than twice that of a clinic at $300 with four.
What This Looks Like at One Clinic
Numbers in the abstract are easy to nod at and hard to act on. So here is one location, worked all the way through.
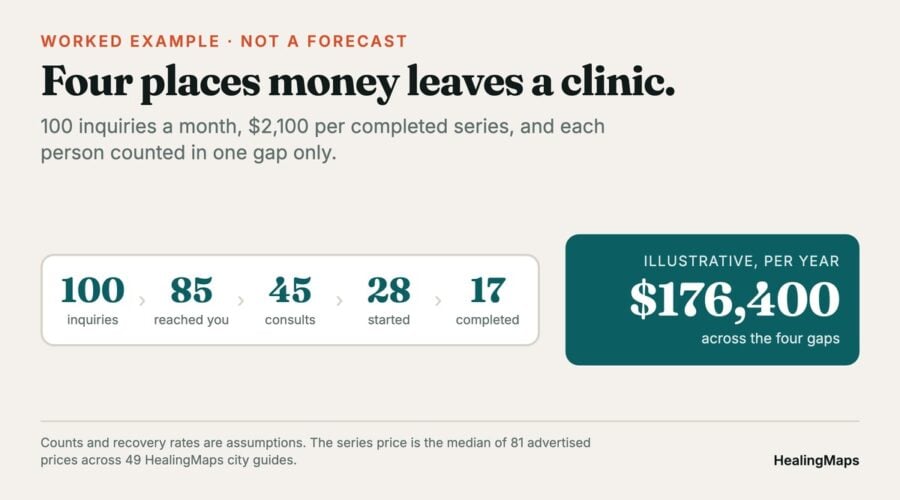
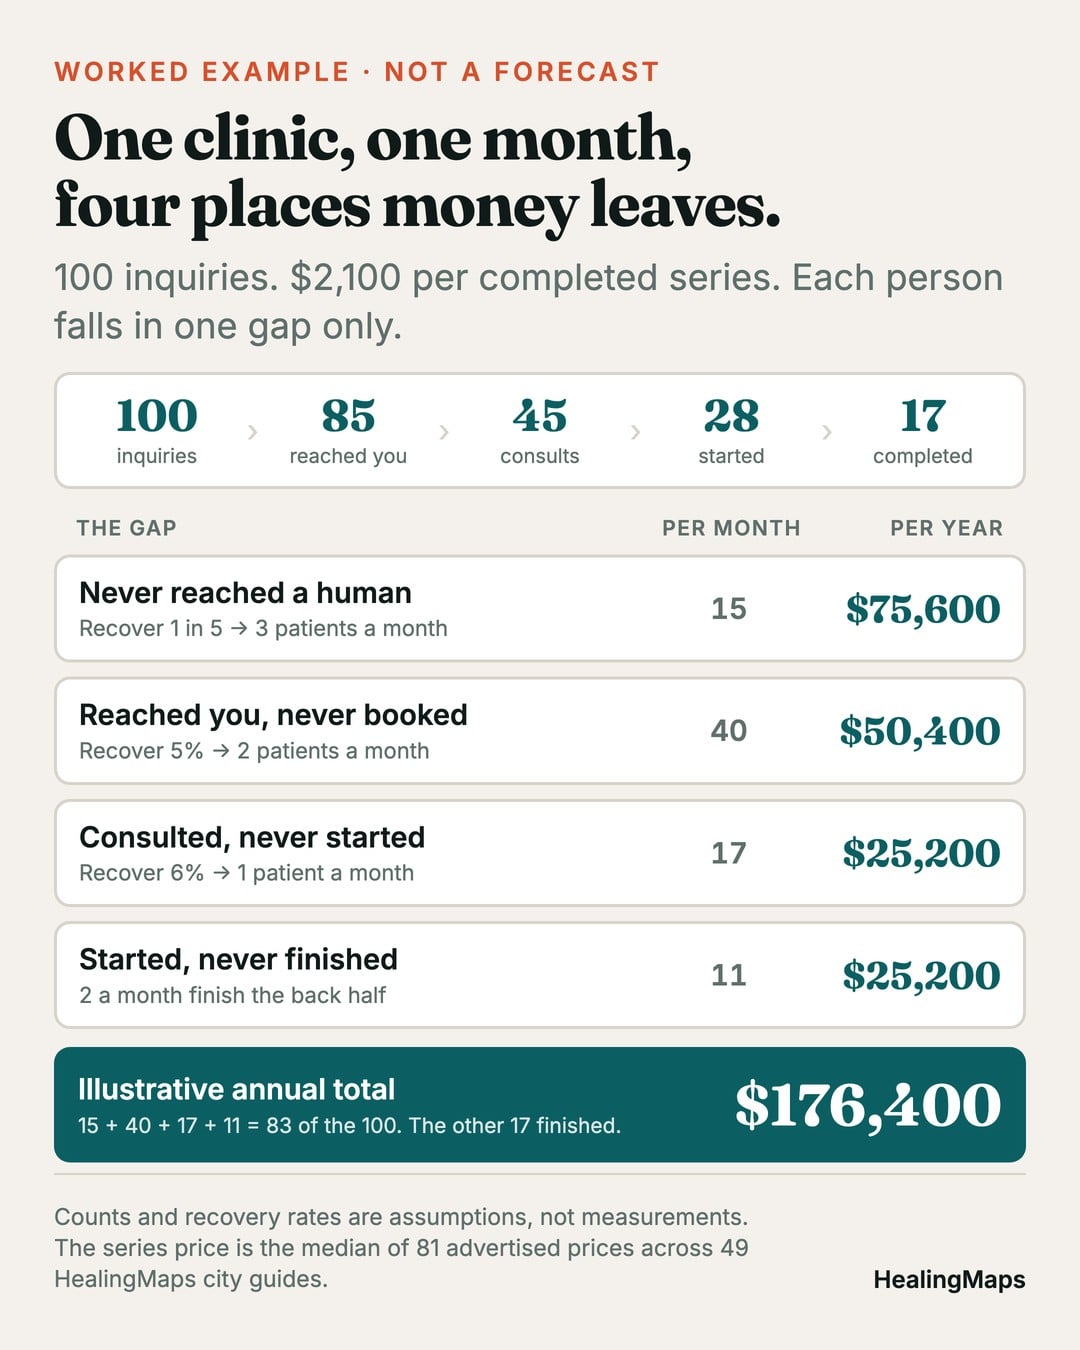
Assume 100 inquiries a month across phone, web form and email. Assume a completed induction series is worth $2,100, which is our median. Both of those are placeholders for your own figures. The four gaps below do not overlap. Each person is counted in one of them and no more.
Fifteen calls a month ring out or arrive after hours. If one in five of those people would have become a patient, that is three a month. Over a year that is 36 patients, or $75,600.
Forty more reach someone and still never book a consult. These are a separate forty from the fifteen above, whose calls were never answered. Recovering five percent of them is two patients a month, or $50,400 a year.
Seventeen consults happen and never become a first infusion. Recovering six percent is one patient a month, or $25,200.
Eleven patients a month begin a series and stop partway. If two of them finished the back half instead, at roughly half a series each, that is another $25,200.
Those four groups come to 83 of the original hundred. The other 17 finished their series. Added up, the illustration comes to $176,400 a year.
Now the part that matters more than the total. Every count in that example is invented and every recovery rate is a guess.
Your phone system has the real first number. Your scheduler has the second and the third. Your chart notes have the fourth.
The arithmetic is the transferable part. The figures are not, and any vendor who hands you figures like these as a promise is selling you a spreadsheet rather than a measurement.
Number One: The Calls Nobody Answered
Pull 30 days of call data from your phone system. You want two counts: calls that rang out during business hours, and calls that arrived outside them.
This is the number AI tools are genuinely built to address. It is also the only one here where the software does the whole job.
A missed call from someone seeking ketamine is not a deferred sale.
That person is calling three clinics the same afternoon, and the one that picks up gets the consult.
Number Two: Inquiries That Never Booked
Count every inbound inquiry in the same 30 days, across phone, web form and email. Then count how many became a scheduled consult.
The gap between those two numbers is mostly response time and follow-up. That is partly a software problem and partly a staffing one.
Be careful attributing all of it to tooling. Some of those people were price-shopping and were never going to book anywhere.
Number Three: Consults That Never Started
Count consults held, then count how many of those patients began a series. This gap is usually about cost conversations, scheduling friction and second thoughts.
Software can smooth the scheduling part. It cannot have the cost conversation for you, and that is often what the gap actually is.
Number Four: The Series Nobody Finished
Count patients who began an induction series and how many completed it. For ketamine this is the number that usually dominates the arithmetic.
A patient who stops after three of six has paid for half a protocol. They also received an incomplete course of treatment.
That is lost revenue and a worse outcome at once.
We do not have a reliable industry completion figure, and we are not going to invent one.
Measure yours, and treat any vendor who quotes you a benchmark here with suspicion.
Reminders and outreach can move this number. They cannot move it as far as a vendor deck implies. Most of the reasons people stop are not reasons a text message solves.
Putting It Together
The arithmetic is deliberately simple. Take the count from each gap. Multiply it by the share you believe you could realistically recover. Then multiply that by your per-patient value.
Say you miss 15 calls a month and believe one in five would have become a patient. At a $2,100 series that is three patients, or roughly $75,000 a year.
Those recovery rates are your estimate, not a measurement. That is the weak point in every version of this calculation, including ours. State them out loud so you can argue about them.
Then compare the total against what the software costs. Say a tool runs $1,500 a month. At our median price it needs to recover roughly nine completed series a year just to break even.
Why We Are Not Quoting the Vendor Numbers
The widely circulated figures here trace back to the companies selling the software. Several trace to their investors.
Very few trace to independent research.
They also disagree with each other. One widely shared deck puts unanswered daytime calls at one in six. Vendor blogs put missed inbound calls at anywhere from 23 to 42 percent.
Case studies carry the same problem. A frequently cited dermatology example credits an entire year-over-year rise in bookings to an AI rollout. It adjusts for neither seasonality nor marketing spend.
None of that means the tools do not work. It means the published numbers cannot tell you whether they work for you. That is why all four counts above start in your own system.
What to Do With the Answer
If your four numbers are small, the honest conclusion is that software is not your constraint this year.
That is a useful finding and it costs nothing to reach.
If number one is large, a phone tool has a clear case and a measurable before and after. If number four is large, the fix is more likely clinical and operational than technological.
Run the counts again 90 days after any rollout, against the same report.
A vendor who will not agree to that measurement in advance is telling you something.
Clinics comparing their own market can start with our directory of verified ketamine clinics. Our count of what clinics actually offer shows how the field is structured.
This article is for informational purposes and is not financial advice. Price figures are the median of advertised prices from 49 HealingMaps city guides, October 2026. Advertised prices may differ from what clinics collect.